What Is ROAS and How Do You Calculate It? A Guide for E-Commerce Advertisers

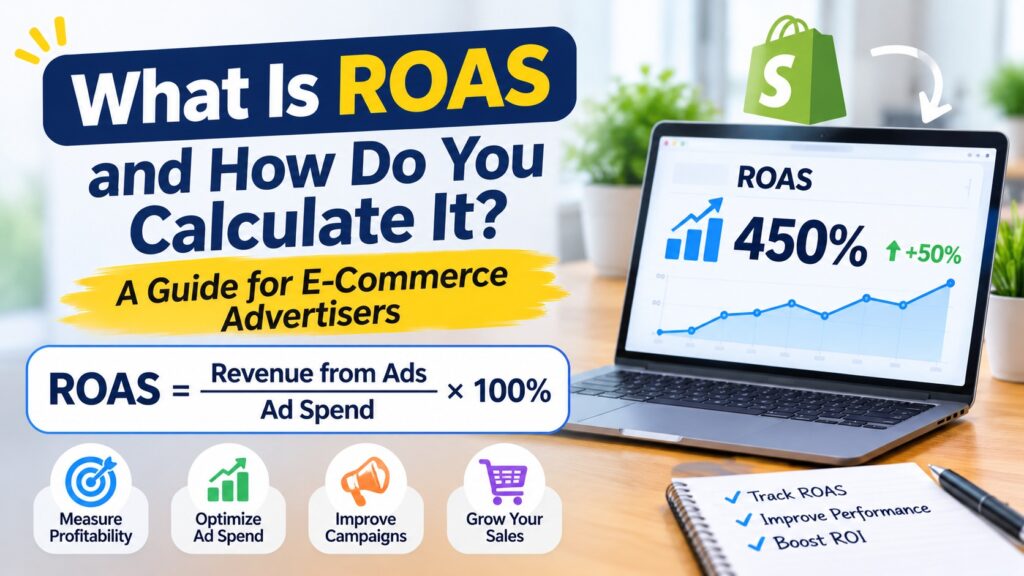
Learn what ROAS means, how to calculate it, what a good ROAS looks like, and why accurate attribution data matters for trusting the number.
ROAS is one of the most quoted metrics in paid advertising, but it is also one of the easiest to misread. This guide explains what it is, how to calculate it, and why the data behind the number matters as much as the number itself.

What Is ROAS?
ROAS stands for return on ad spend. It tells you how much revenue you earn for every dollar spent on ads.
The ROAS Formula
ROAS = Revenue from ads ÷ Ad spend
For example, if you spend $1,000 on ads and they generate $4,000 in revenue, your ROAS is 4.0, often written as 4x or 400%.

ROAS vs ROI vs Profit
ROAS only looks at revenue relative to ad spend. It does not account for product costs, shipping, fees, or other expenses. A 3x ROAS can be profitable for a high-margin product and unprofitable for a low-margin one. That is why many advertisers also track margin and customer lifetime value, not ROAS alone.
What Is a Good ROAS?
There is no universal answer. A good ROAS depends on your margins, your business model, and whether customers buy again. A store with high margins and strong repeat purchases can accept a lower first-order ROAS than a store with thin margins and one-time buyers. Work out your break-even ROAS from your own costs, then aim above it.
Why the Revenue Number Can Be Wrong
The formula is simple, but the revenue figure is not always reliable. Ad platforms attribute conversions using their own windows and rules, multiple platforms may claim the same order, and browser limits can hide part of the journey. As a result, the ROAS in your ad dashboard may not match what your store actually earned.

How Better Attribution Helps
An attribution tool such as TrueROAS ties conversions to exact order numbers in your store, so the revenue behind your ROAS can be verified. It also records customer journeys and shows lifetime value by traffic source, which gives you a fuller picture than first-purchase ROAS alone.
The company reports an average 17.1% ROAS lift across its stores, measured 90 days after install versus the 90 days before. That figure is a vendor-reported average and your own results may differ.
Practical Tips for Using ROAS
- Use a consistent attribution window: Compare like with like
- Check against store revenue: Sanity-check platform numbers against real orders
- Segment by campaign and creative: Averages can hide winners and losers
- Pair ROAS with margin: Know your break-even point
- Look at LTV: Some channels bring customers who buy again
Wrapping Up
ROAS is a useful signal when the data behind it is sound. If you want to know your real numbers, try TrueROAS with the free plan for stores under $10k per month or a 14-day trial on paid plans, and compare it with what your ad platforms report.



Join the discussion